


March corn spent the day drifting lower from the daily high of $3.9975/bushel to close about 10 cents lower. However, it is premature to interpret this price action as a bullish scenario that has run out of steam. General Comments It was a rather slow day of trading but not uneventful as patterns continue to develop. For example, turn a chart of March corn from daily into weekly and a nice looking "v bottom" technical chart pattern emerges. Less attractive but similar v bottom chart patterns exist in March soybeans, soymeal and Chicago wheat. The v bottom formation in these other contracts is less symmetrical than in the case of March corn, but the sibilance of a pattern still exists in each. Sloppier patterns just tend to have lower prob...


 What You Need to Know Today: Chinese purchases of U.S. soybeans continued to accelerate, with USDA reporting another 558 KMT sold to China and 236 KMT to unknown destinations. Combined with sales announced Wednesday and Thursday, the latest purchases bring the three-day total to approximately...

 Key Takeaways: With the fall calf run now upon us, producers are finally getting a glimpse of what their realized profits will be for 2026. Some producers may have already obtained a strong estimate of 2026 revenues, especially if calves were forward sold in, for example, the mid-summer...
 As fall begins, wild migratory birds are starting their seasonal migration. That has the industry and government officials worried about the potential spread, again, of highly pathogenic avian influenza (HPAI). Some members of Congress have called for the United States to be prepared for a pote...

From WPI Consulting
Infrastructure investment due diligence
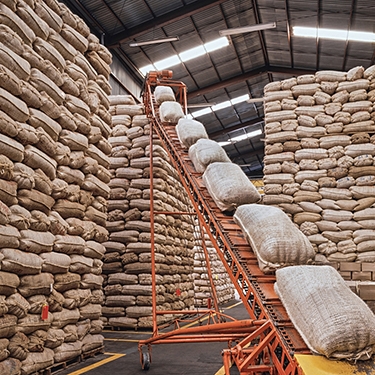
On behalf of a Canadian oilseed processer WPI's team provided market analysis, econometric modeling and financial due diligence in support of a $24 million-dollar investment in a Ukrainian crush plant. Consistent with WPI's findings, local production to supply the plant and the facility's output have expanded exponentially since the investment. WPI has conducted parallel work on behalf of U.S., South American and European clients, both private and public, in the agri-food space.