
USDA’s soybean outlook - U.S. soybean supply and use changes for 2019/20 include lower exports, seed use, and residual use, higher crush, and higher ending stocks. Soybean exports are reduced mainly on strong competition from Brazil. Higher crush only partly offsetting lower exports, seed, and residual use – so ending stocks are projected at 480 million bushels, up 55 million. Lower seed use reflects plantings for the 2020/21 crop indicated in the March 31 Prospective Plantings report. The season-average soybean price is forecast at $8.65 per bushel, down 5 cents. ...


 Key Takeaways: Dry bulk markets remain mixed with Capesize vessels seeing continued pressure from weaker demand while fixtures and rate strength gradually increases towards the smaller vessel classes. Tanker markets are pulling back from their recent highs as tonnage moves out of the Mid...

 The Trump import plan for 300,000 MT of beef supplies used for ground beef, i.e., lean trim, from September through November has, according to Secretary Brooke Rollins, brought some relief to beef prices. The Executive Order states that the Secretary of Agriculture will analyze and review the m...
 Key Takeaways: Texas illustrates the assumptions underlying the 2025 FMMO reform; Idaho exposes their limitations. The Southwest order blend (roughly 27 percent Class I, 32 percent Class III and 31 percent Class IV) exposes Texas producers to every lever USDA adjusted, with a near-neutral proj...


From WPI Consulting
Forecasting developments in production agriculture
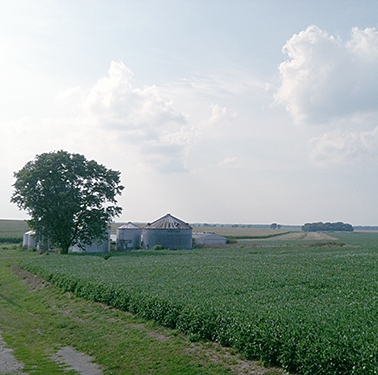
On behalf of a private U.S. agricultural technology provider, WPI’s team generated an econometric model to forecast the movement of concentrated corn production north and west from the traditional U.S. Corn Belt. WPI’s model has subsequently provided quantitative support to a multi-million-dollar investment into short-season corn variety development. WPI’s methodology included a series of interviews with regional grain elevators and seed consultants. Emphasizing outreach and communication with stakeholders who possess intimate sectoral knowledge – on-the-ground insights – is a regular component of WPI’s methodologies, made possible by WPI’s ever-growing network of industry contacts.